See exactly what your agent did. Fix it before it matters.
When something breaks at 2am, you need answers fast. Observability gives you full visibility into every session, replay every action, and trace every decision, so you're debugging behavior, not guessing at it.
Agents fail in ways logs don’t explain.
A selector changed. A modal blocked the next step. A model made a bad call. These aren't errors you'll catch with a stack trace. You need to see the session. Observability surfaces the moment things went wrong, the state of the page at that moment, and the exact prompt your model was working with. When you can see the full picture, you can fix the right thing.
A debugging layer built for agents, not just apps.
Debug in minutes, not hours.
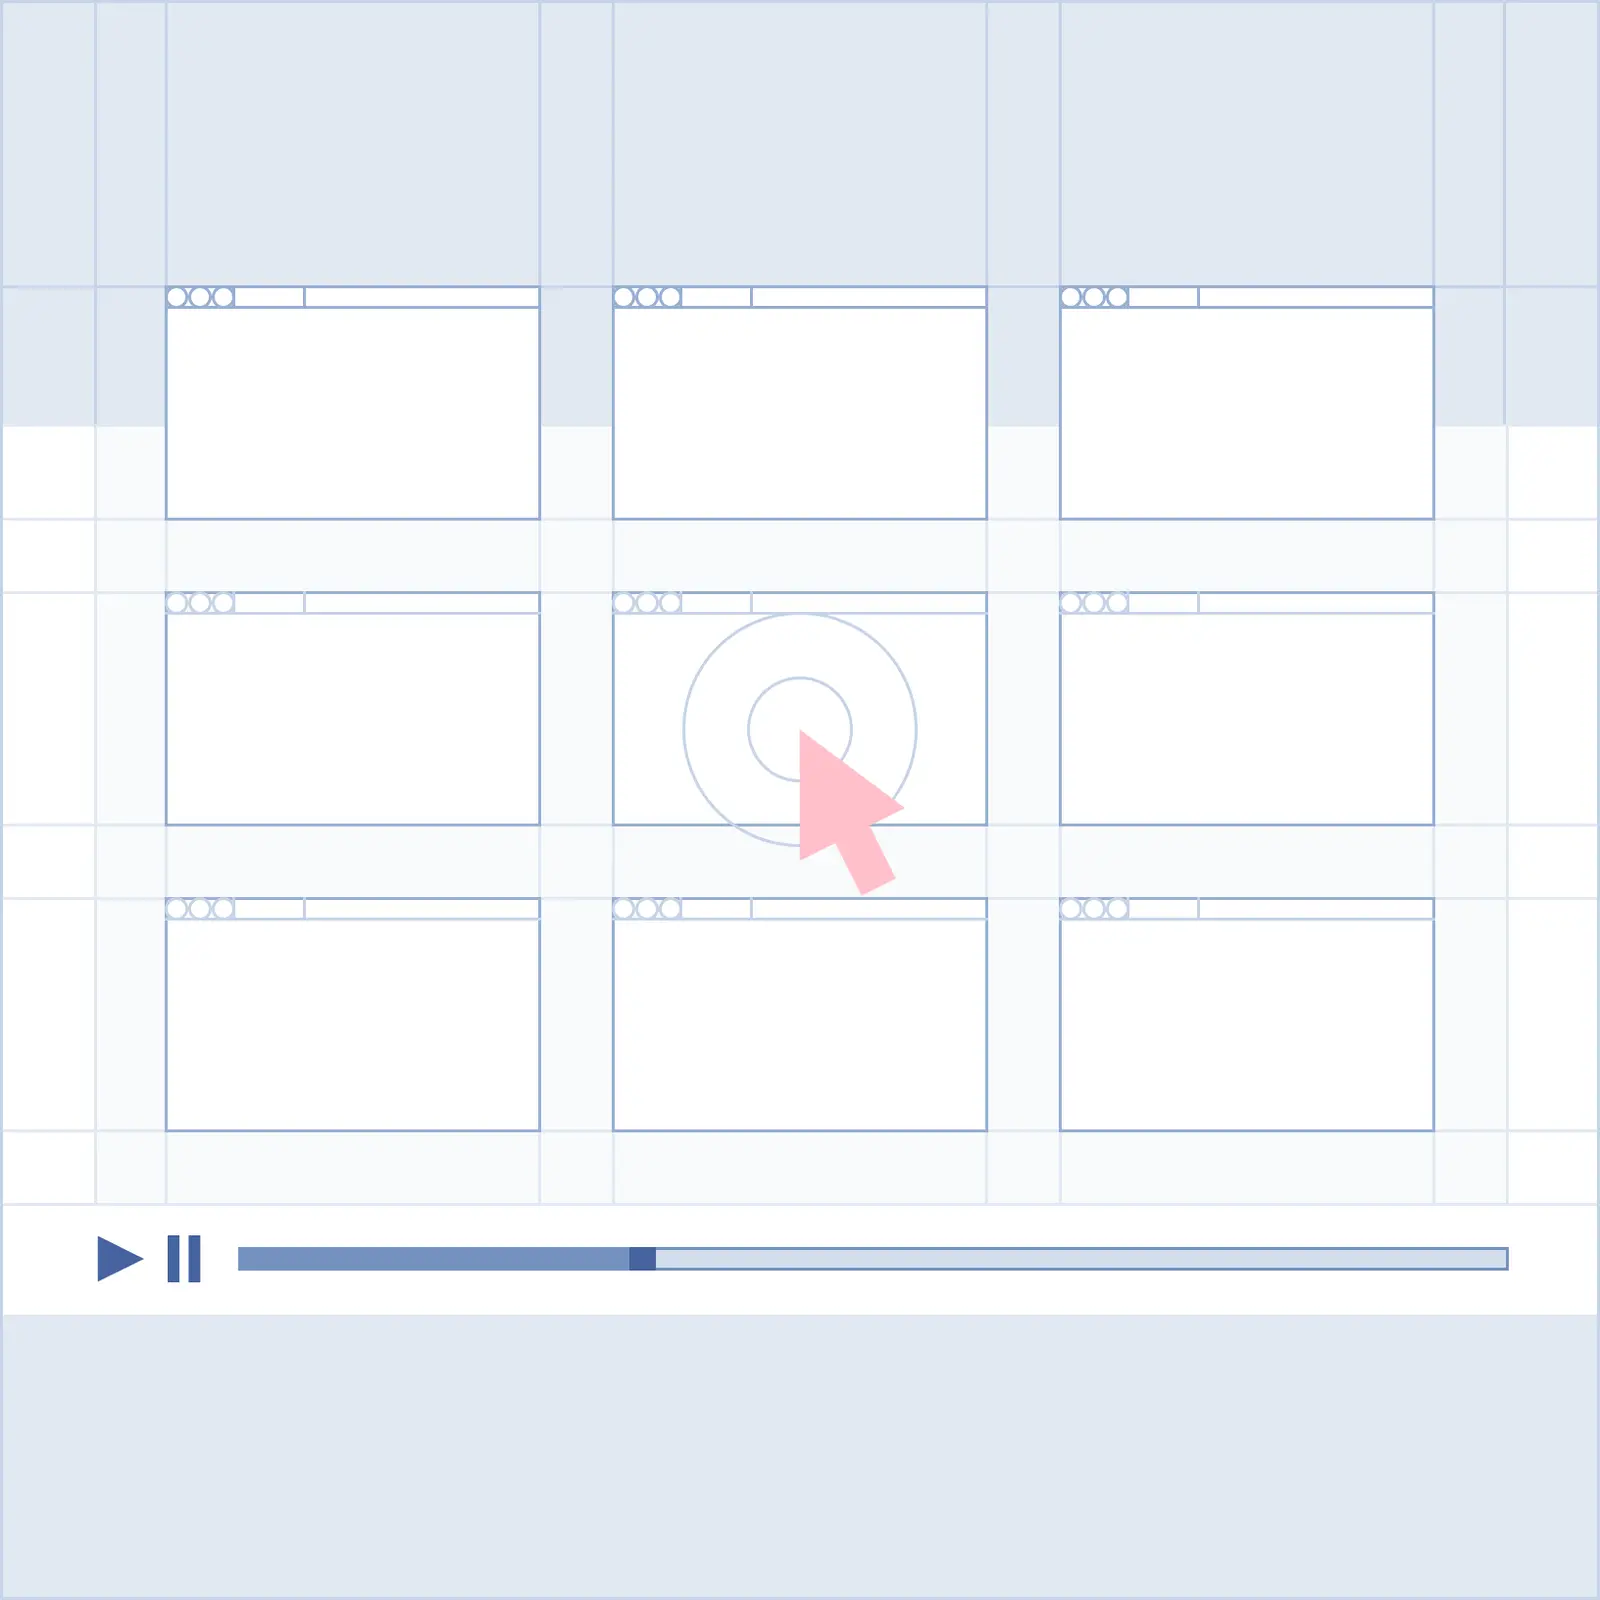
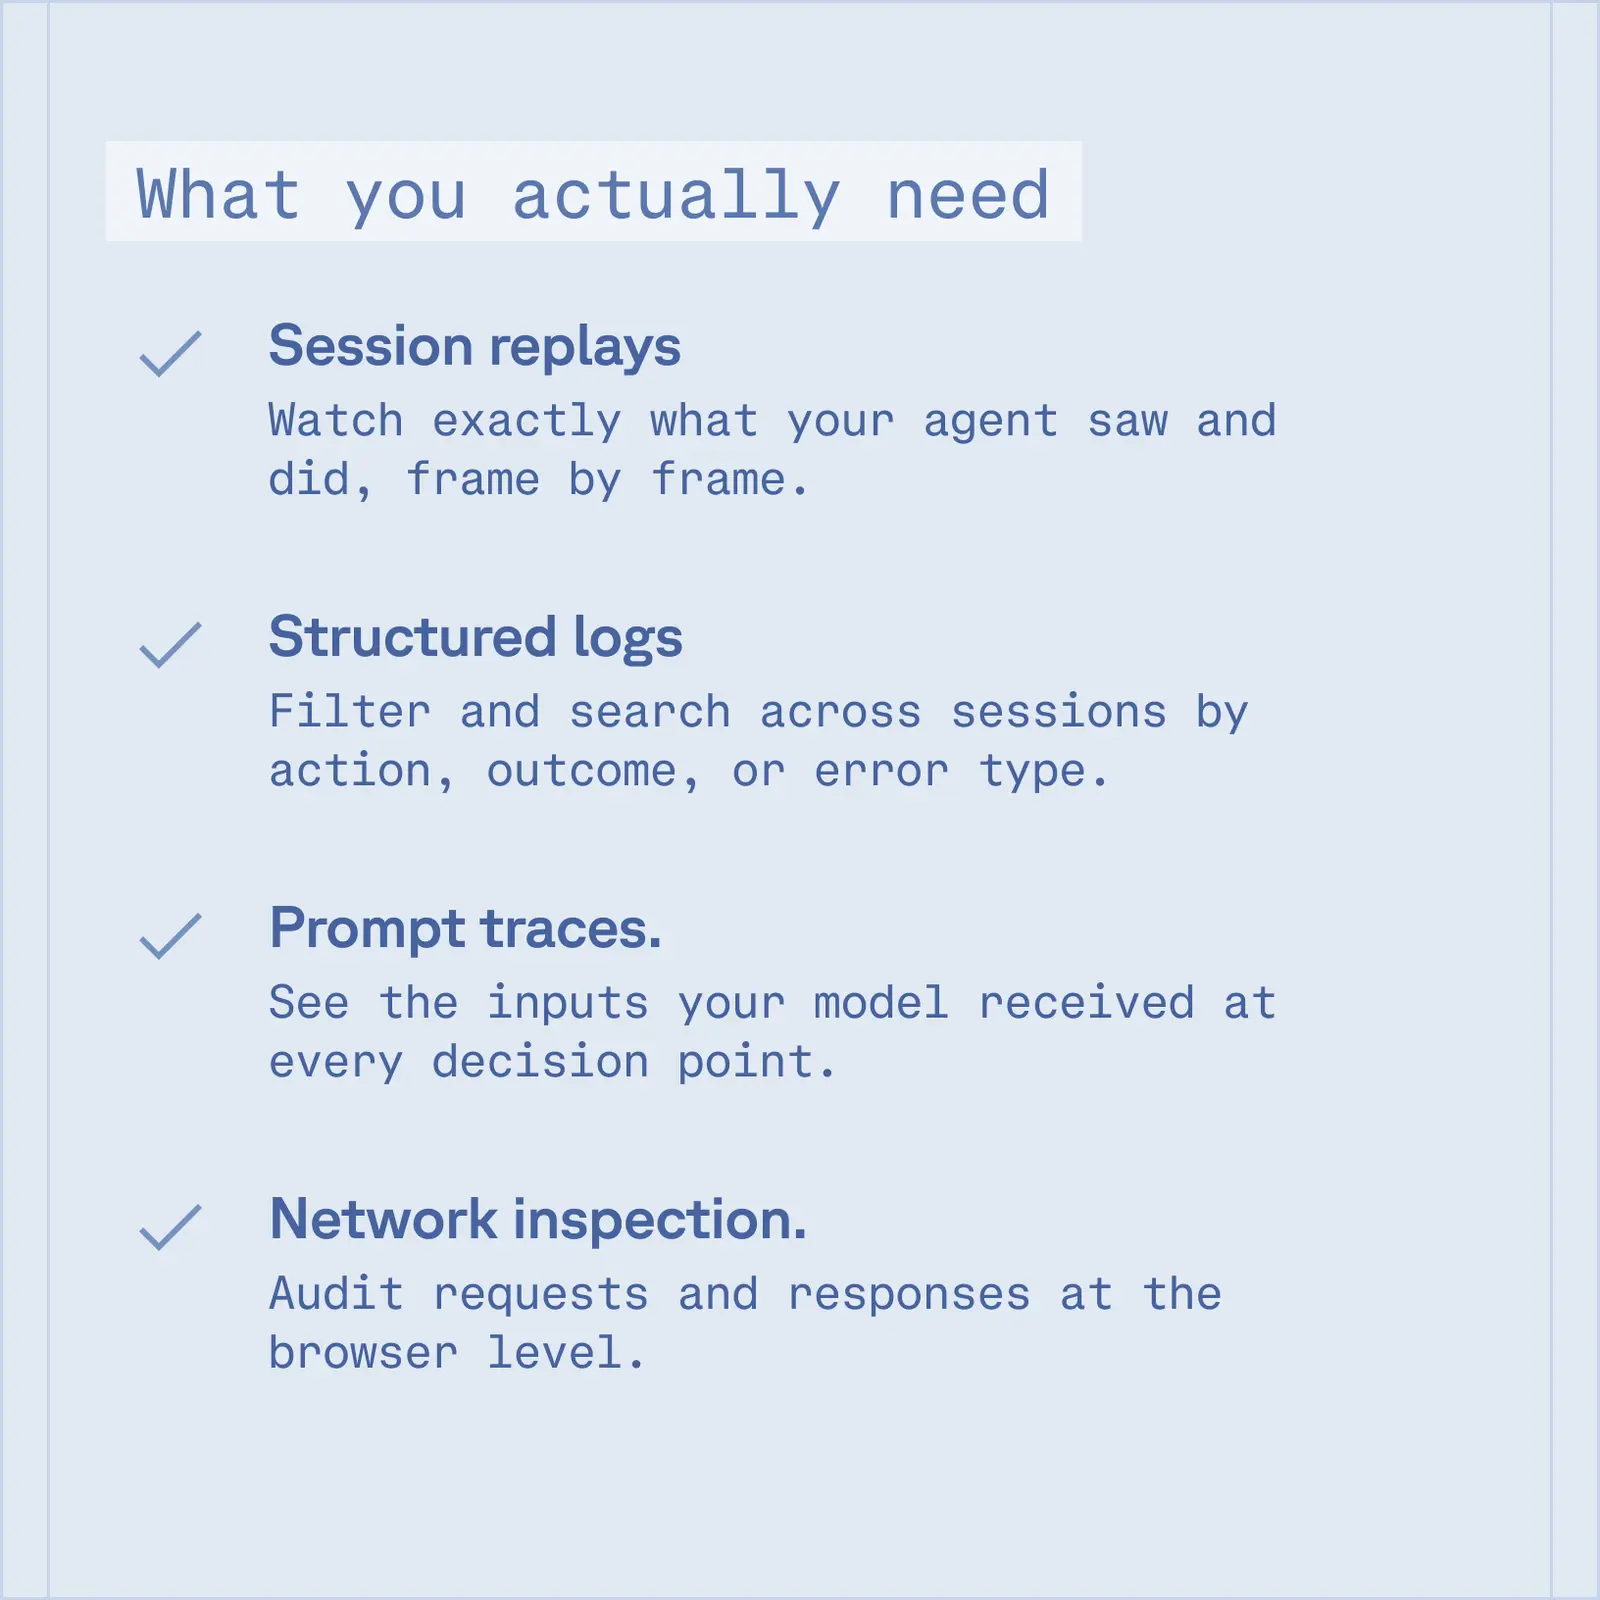
Every browser session is fully observable. Watch sessions live, replay them later, and trace every action your agent took. Rich logs, network traces, and console output in one place. No more guessing why your agent failed on step 47.
Live view
Watch your agent interact with the web in real time. See clicks, navigation, and page state as they happen. Share a live session link with your team to debug together.
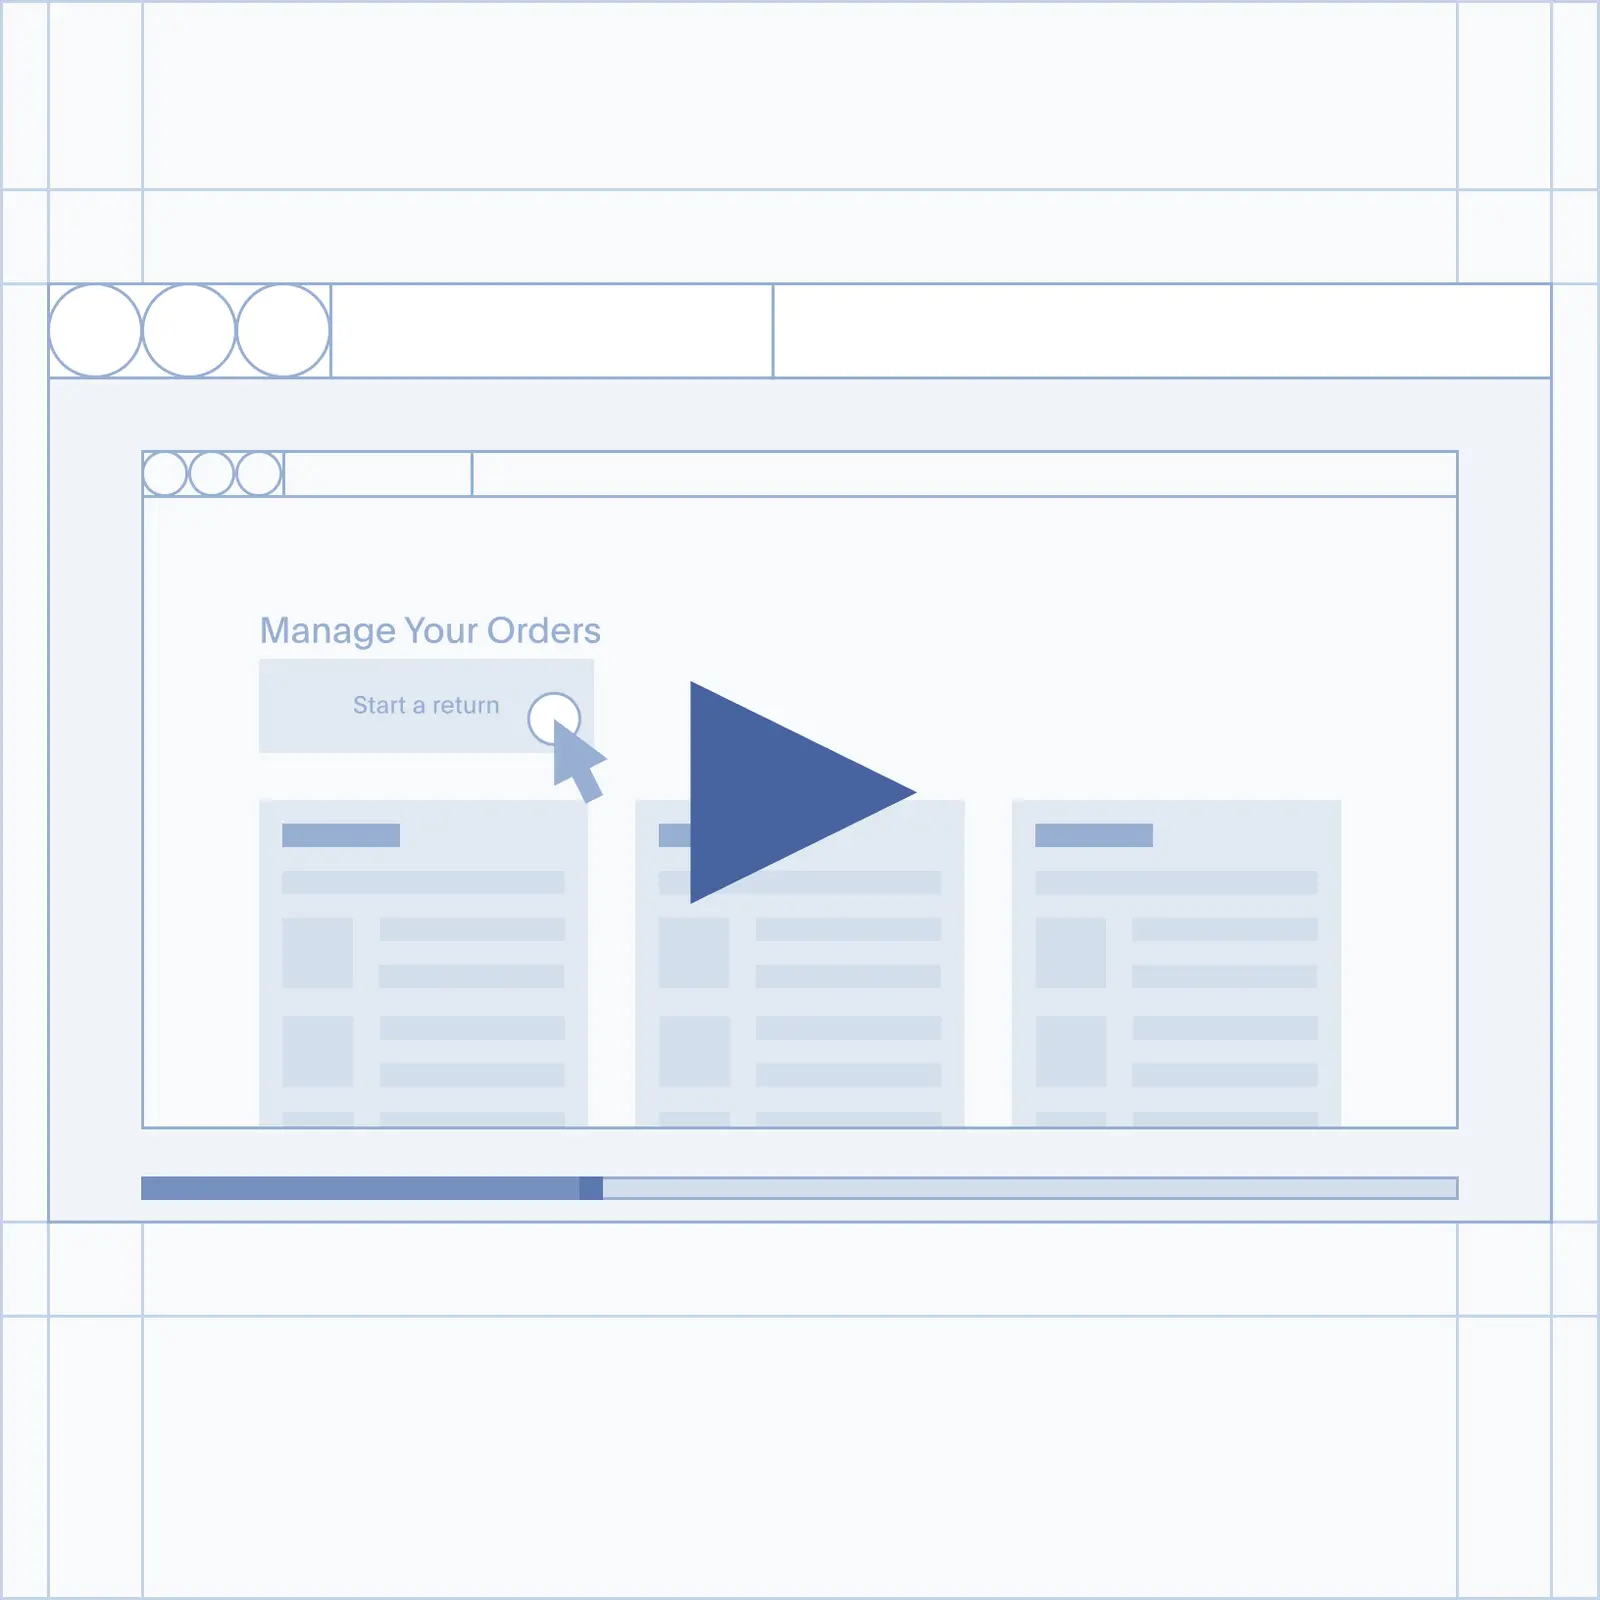
Session replay
Every session is recorded automatically. Replay any run to understand exactly what happened, step by step. Pair recordings with structured logs to pinpoint failures in seconds.
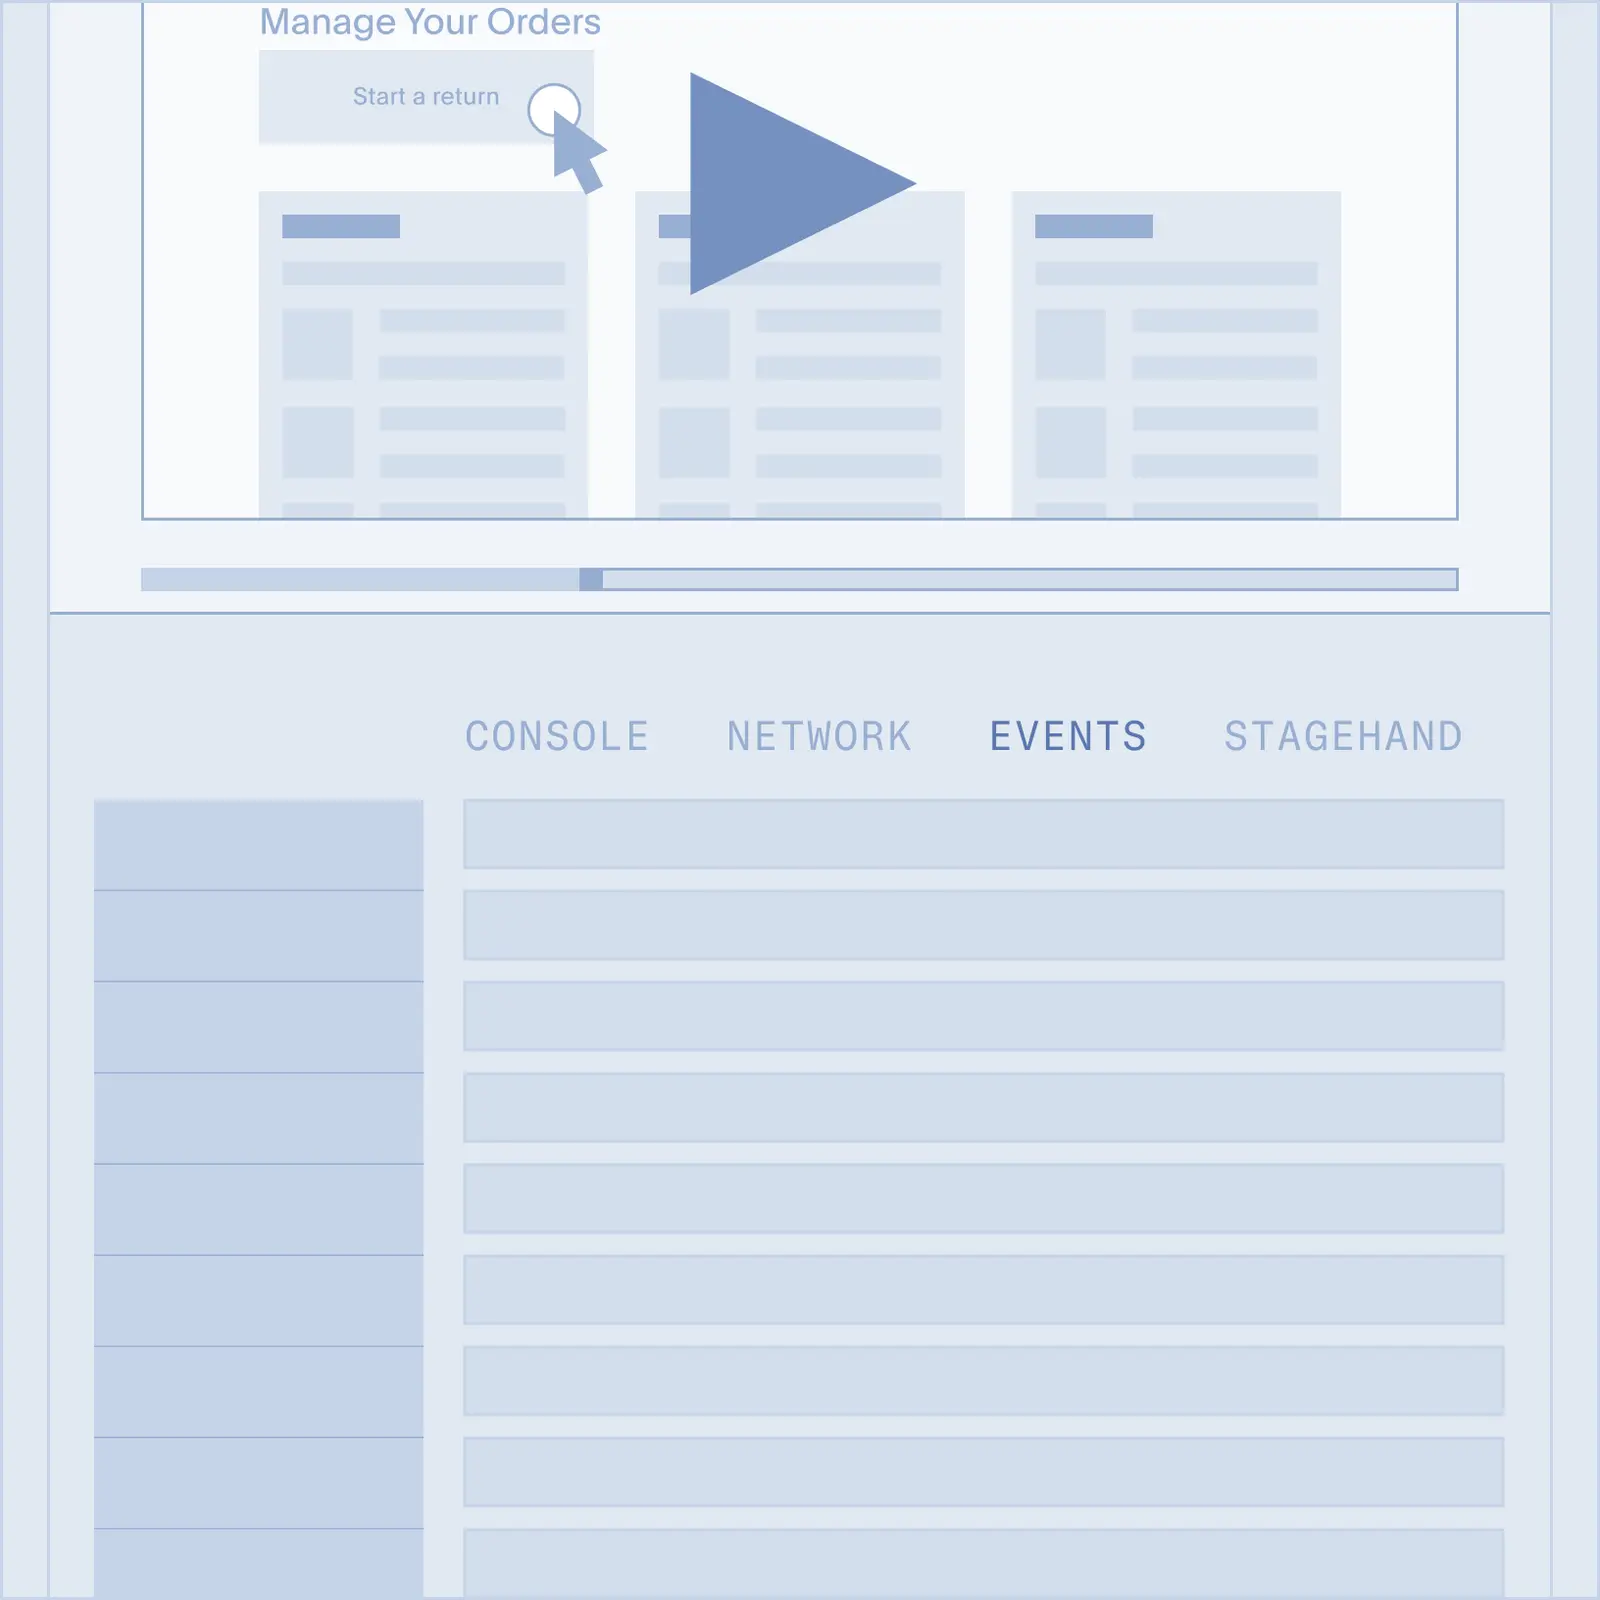
Logs and traces
Structured logs for every session capture network requests, console output, errors, and timing. Filter, search, and correlate events across thousands of parallel runs.
The teams shipping serious agents are already here.
Observability is built into the Browserbase platform, not bolted on. The same infrastructure that handles scale, isolation, and reliability also captures every session detail automatically. You don’t configure it. It’s just on.


Start seeing what's happening.
Connect your agent to Browserbase and every session is observable by default. No instrumentation, no setup, no separate service to maintain.